


| CAT No | Product | Size | Price |
|---|---|---|---|
| PB71.11-01 | NGSBIO Library Quant Kit for Illumina® Lo-ROX | 100 x 20 μL Reactions | Contact us |
| PB71.11-05 | NGSBIO Library Quant Kit for Illumina® Lo-ROX | 500 x 20 μL Reactions | Contact us |
| PB71.12-01 | NGSBIO Library Quant Kit for Illumina® Hi-ROX | 100 x 20 μL Reactions | Contact us |
| PB71.12-05 | NGSBIO Library Quant Kit for Illumina® Hi-ROX | 500 x 20 μL Reactions | Contact us |
| PB71.14-01 | NGSBIO Library Quant Kit for Illumina® Separate-ROX | 100 x 20 μL Reactions | Contact us |
| PB71.14-05 | NGSBIO Library Quant Kit for Illumina® Separate-ROX | 500 x 20 μL Reactions | Contact us |
| PB71.22-05 | NGSBIO DNA Standards for Illumina® | 500 x 20 μL Reactions | Contact us |
To view your prices, please login or register with your quote reference.
Additional Information
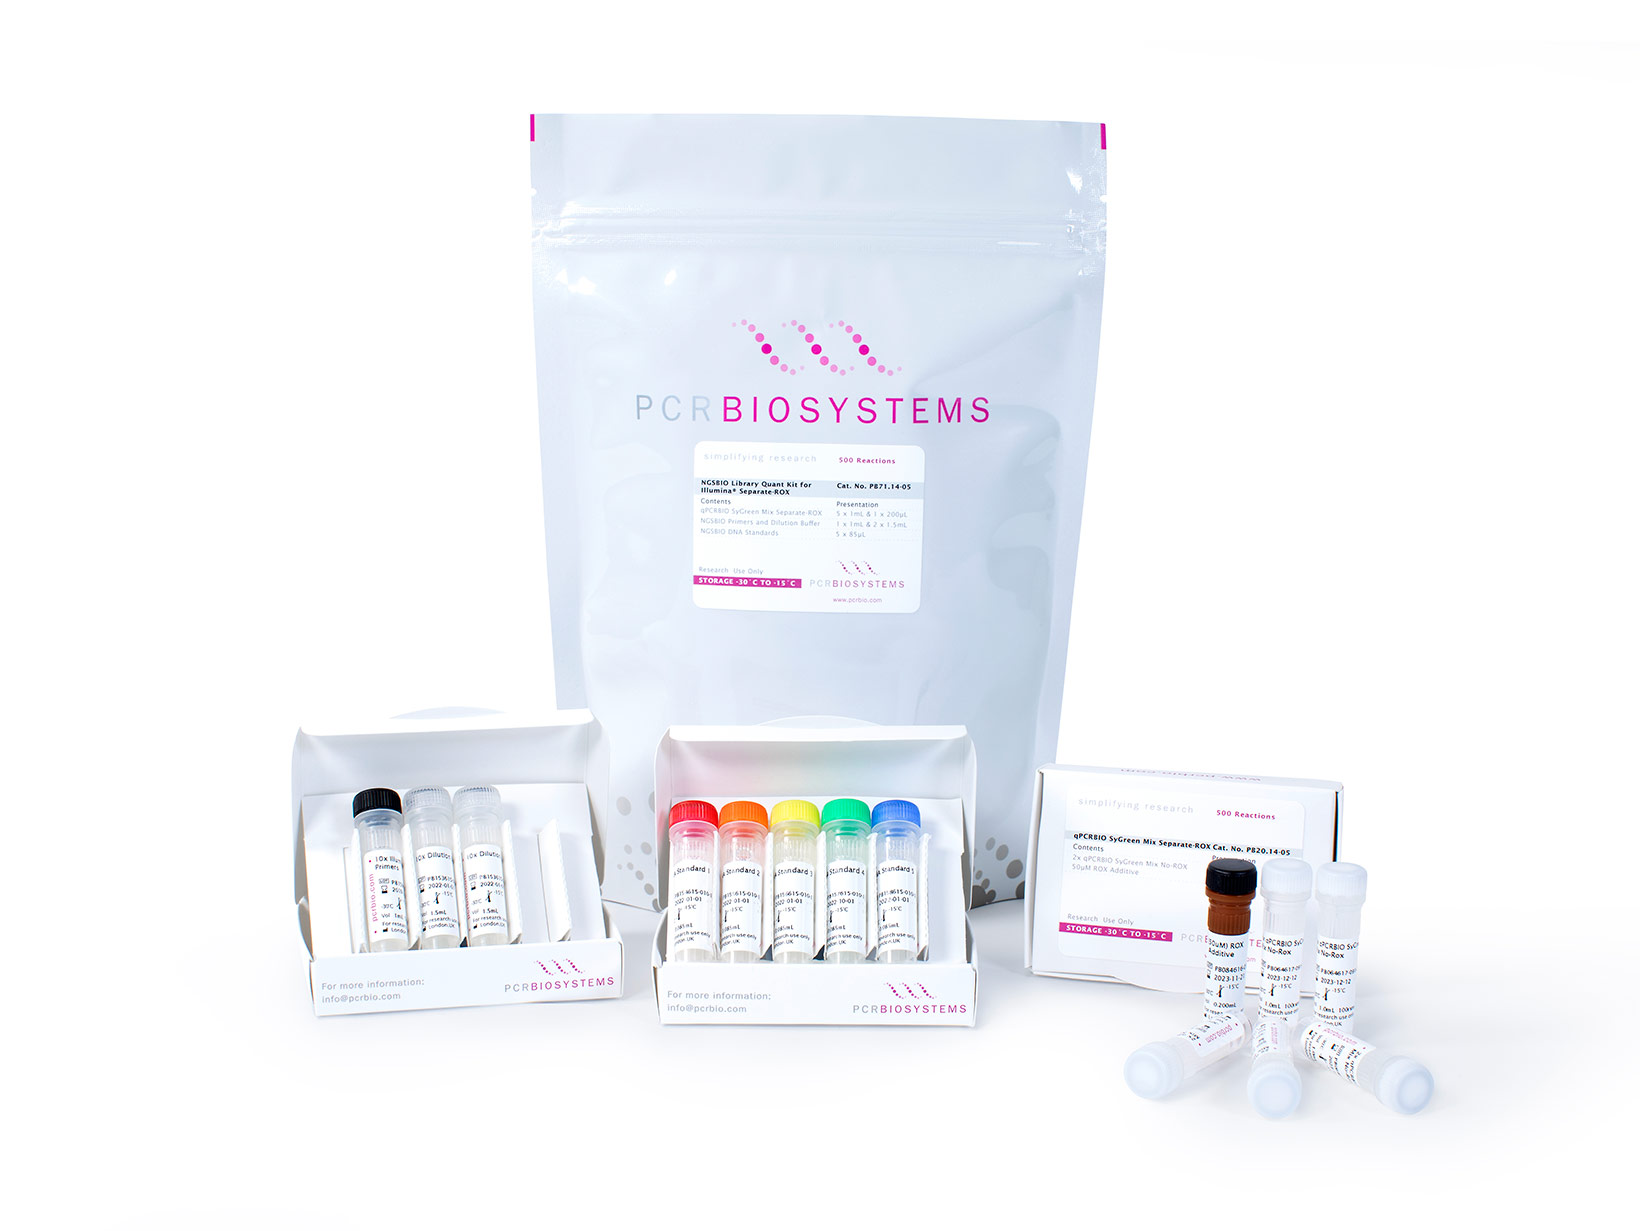
The NGSBIO Library Quantification Kit provides a reliable qPCR-based method for quantifying libraries prepared for Illumina NGS systems. The product includes 5 DNA standards, specific primers for Illumina's P5 and P7 adapter sequences, and qPCRBIO SyGreen® Mix. Our advanced qPCR buffer system has been developed using our high-throughput smart screen technology to ensure effective amplification for all your libraries, including those with high GC or AT content. The product also comes with a convenient library dilution solution. This kit can also be used in conjunction with VeriFi™ Library Amplification Mix.
Accurate Library Quantification
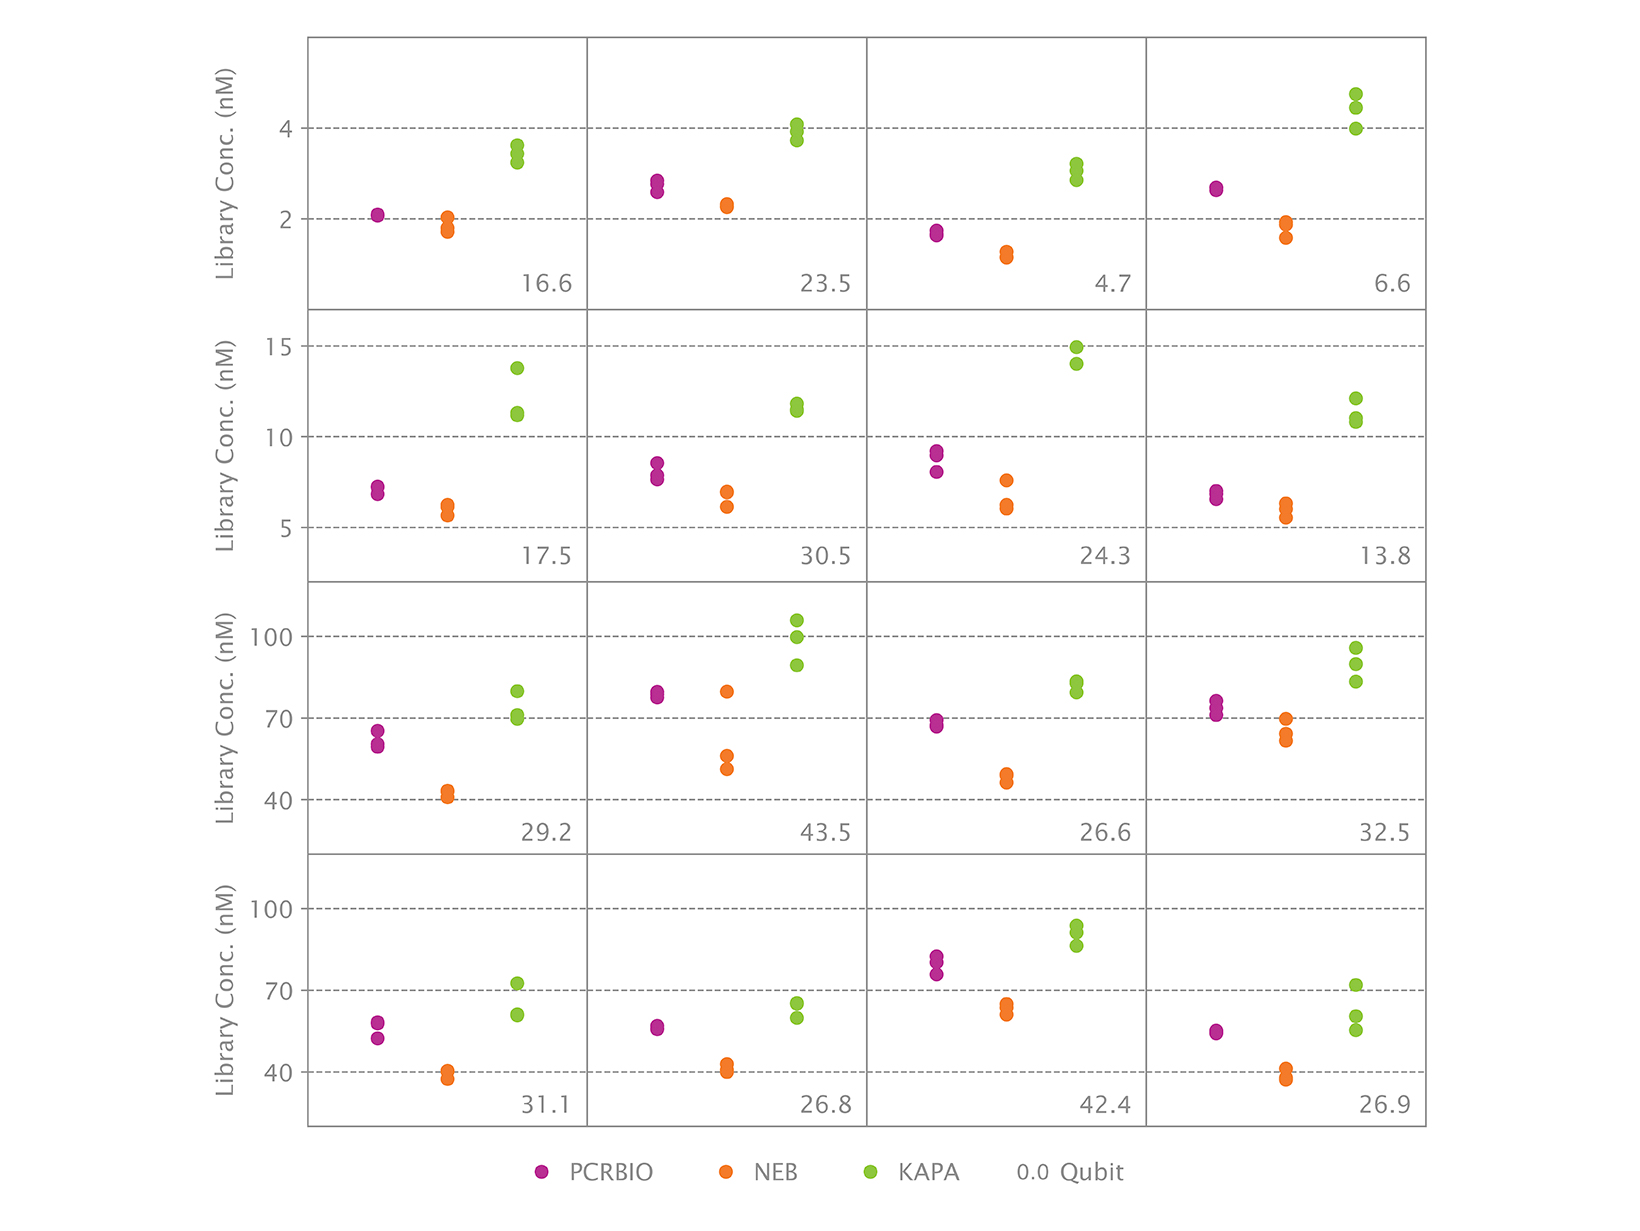
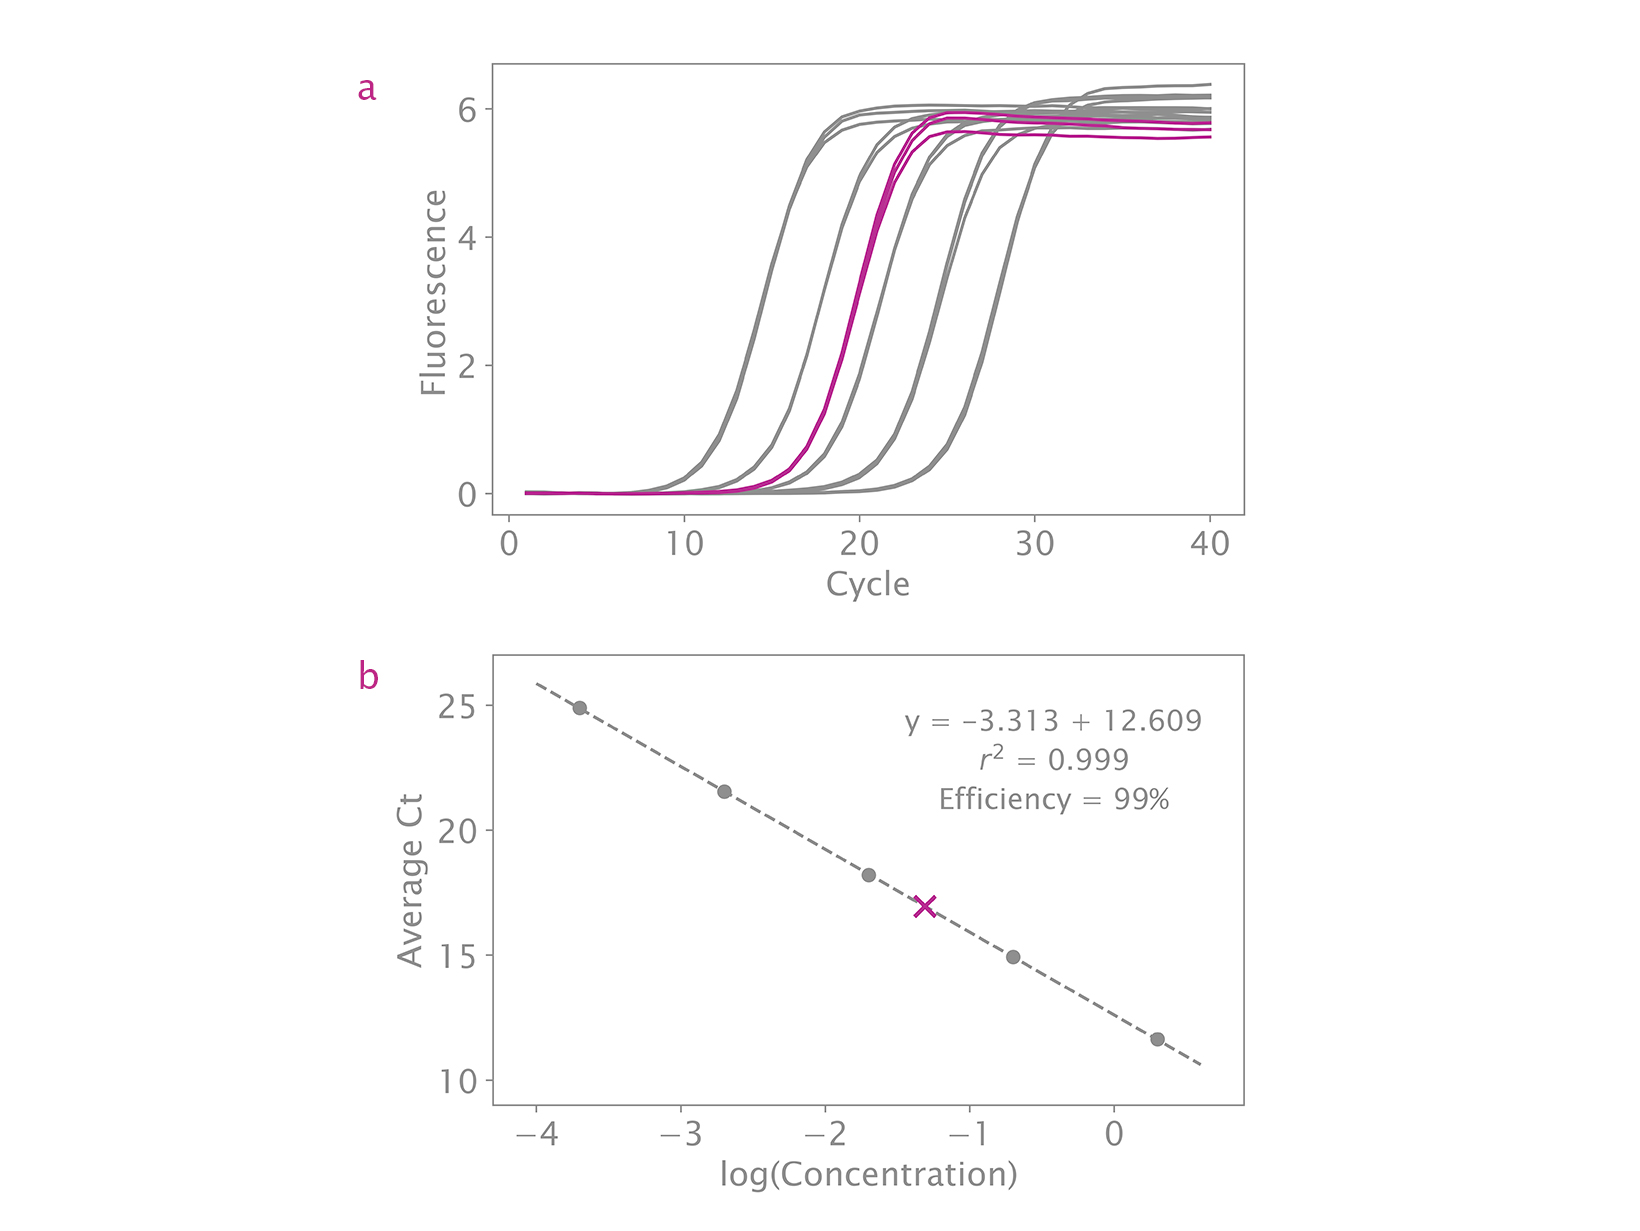
qPCR is considered the best method for quantifying NGS libraries because it measures only adapter-ligated molecules that can serve as templates for library amplification and clustering. The NGSBIO Library Quantification Kit allows very accurate quantification, which is critical for optimal cluster density and higher sequencing performance.
Library quantification can be performed at any time after adapter ligation and should always be performed before cluster generation. For easy and accurate data analysis, we recommend using the NGSBIO Library Quantification Tool. Overestimating library concentration can lead to insufficient cluster density and underestimating library concentration can lead to high, saturated cluster density. To learn more about optimal cluster density, refer to your Illumina machine’s handbook.
Wide Dynamic Range
The provided DNA standards are precisely measured and ready to use, ranging from 2pM to 0.2fM. The product is suitable for quantifying low concentration libraries even those built without a PCR amplification step.
Common Product Design
The NGSBIO Library Quantification Kit is compatible with all qPCR platforms and has been optimized to provide consistent and reproducible library quantification over a wide range of sample types, fragment sizes (up to 1000bp), concentrations, and GC content. Use our qPCR Selection Tool to find out which ROX variant is compatible with your device.
For easy and accurate data analysis, we recommend using the NGSBIO Library Quantification Tool.
Applications
- NGS library quantification for Illumina systems
Technical Specifications
NGSBIO Library Quant Kit for Illumina Lo-ROX
| Component | 100 Reactions | 500 Reactions |
|---|---|---|
| 2x qPCRBIO SyGreen Mix Lo-ROX | 1 x 1mL | 5 x 1mL |
| DNA Standards 1-5 | 30μL each | 85μL each |
| 10x Illumina Primers | 1 x 0.2mL | 1 x 1mL |
| 10x Dilution Buffer | 1 x 0.6mL | 2 x 1.5mL |
NGSBIO Library Quant Kit for Illumina Hi-ROX
| Component | 100 Reactions | 500 Reactions |
|---|---|---|
| 2x qPCRBIO SyGreen Mix Hi-ROX | 1 x 1mL | 5 x 1mL |
| DNA Standards 1-5 | 30μL each | 85μL each |
| 10x Illumina Primers | 1 x 0.2mL | 1 x 1mL |
| 10x Dilution Buffer | 1 x 0.6mL | 2 x 1.5mL |
NGSBIO Library Quant Kit for Illumina Separate-ROX
| Component | 100 Reactions | 500 Reactions |
|---|---|---|
| 2x qPCRBIO SyGreen Mix No-ROX | 1 x 1mL | 5 x 1mL |
| 50μM ROX Additive | 1 x 200μL | 1 x 200μL |
| DNA Standards 1-5 | 30μL each | 85μL each |
| 10x Illumina Primers | 1 x 0.2mL | 1 x 1mL |
| 10x Dilution Buffer | 1 x 0.6mL | 2 x 1.5mL |
NGSBIO DNA Standards for Illumina
| Component | 500 Reactions |
|---|---|
| DNA Standards 1-5 | 85μL each |
Reaction Info
| Reaction Volume | Storage | |||
|---|---|---|---|---|
| 20μL | Upon receipt, the product should be stored between -30 and -20 °C. If stored correctly, the product will maintain full activity until the specified expiration date. |
Instrument Compatibility
This product is compatible with all standard and fast qPCR instruments. Use our qPCR selection tool to find out which ROX variant is compatible with your device.
Documents
Product Flyer
Manuals
Frequently Asked Questions (FAQs)
My sample is outside the standard range. Do you have any troubleshooting suggestions?
Check the melt curve to ensure there's a single peak. If multiple peaks are observed, there might be contamination or unligated adapters. Otherwise, if samples appear before DNA Standard 1, dilute the sample 100-fold and repeat. If samples appear after DNA Standard 5, use a sample diluted 100-fold higher.
My standard curve is uneven. Is this of concern?
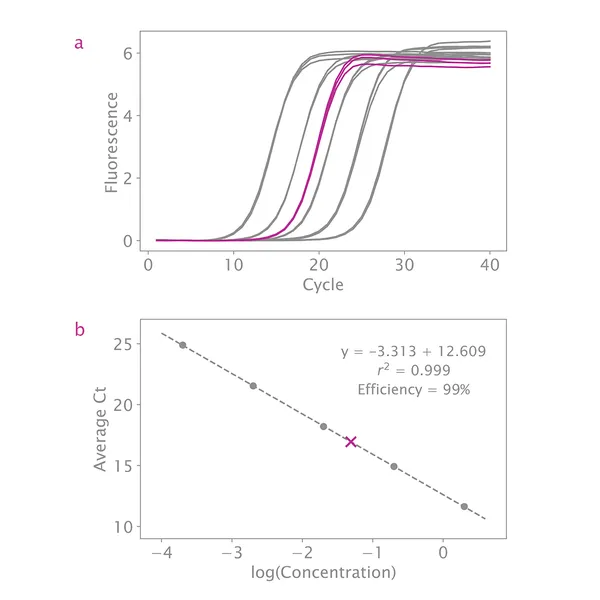
If your standard curve's overall efficiency is between 90% – 110% and your R2 value is close to 1, then this is not a concern. As long as the slope of the line through all standards is between 3.1 – 3.6, quantification will be accurate.
My standard curve efficiency is not between 90 – 110%. Do you have any troubleshooting suggestions?
Inspect the curve for outliers. If any data point appears far from the fitted curve, remove that data point and see if the efficiency improves. At least three standards are needed for a reliable standard curve, so you can remove up to two standards completely. However, each standard needs at least two measurements, and only samples falling within the remaining standards can be quantified.
Check the No Template Control (NTC) to ensure it has a Cq greater than DNA Standard 5. If the NTC is within the standard range, there might be contamination in your standards or reaction mix. This may come from other samples on the plate, or traces of other libraries left on surfaces or laboratory equipment. Clean all utensils and surfaces thoroughly and repeat the experiment with new aliquots of reagents.
What if I see significant additional peaks in my samples' melt analysis?
If the peak coincides with the shoulder observed in the standards' melting peaks, it is likely the amplification of Illumina® primers. This can occur when the primer/template ratio is too high, or when there is a large amount of unligated adapters. If the peak is significant, the quantification results will not be reliable and the experiment should be repeated. Ensure the correct amount of primers has been added to the mix and use a higher sample concentration if possible. If the problem persists, the library may need to be re-size selected to remove free adapters.
If multiple peaks are observed that do not correspond to the adapter peaks, it may be due to contamination or a failure in the size selection step in the library preparation process. Repeat the measurement with new library dilutions. If the problem persists, that library may need to undergo additional size selection.
What if I see significant additional peaks in my standards' melt analysis?
It is common to observe a light shoulder on the low-temperature side of the sample's melt peak. If this shoulder is very large, it is likely due to the addition of too much Illumina® Primer Mix or insufficient amount of standards added. In this case, the experiment should be repeated with special care while making the mix and when adding standards to the reaction.
If multiple peaks are observed in the melt curves of the standards, contamination may have been introduced to the reaction. If it occurs across all standards, the contamination lies within the master mix. The experiment should be repeated with fresh aliquots of reagents. If it only occurs within replicates of one standard, that standard's aliquot is contaminated and should be discarded.
What if my R2 value is not between 0.99 and 1.00?
If your R2 value is not close to 1, this indicates the standards are not evenly distributed. Inspect the standard curve plot and remove any data points far from the line. As long as there are three standards with two measurements each, quantification will be accurate.
If the quality of the fit cannot be brought to acceptable levels, the experiment should be repeated. Take special care when pipetting the standards to ensure accurate volumes and prevent contamination.
What should I do if my quantification results with the NGSBIO Library Quantification Kit are inconsistent with measurements from Qubit, spectrophotometer or other methods?
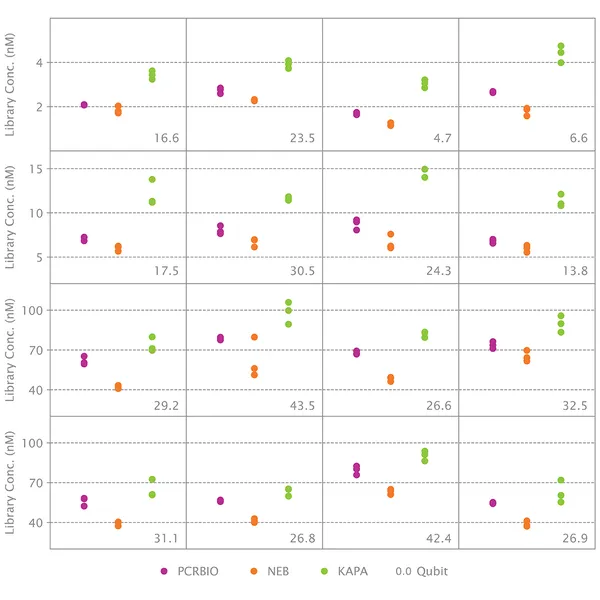
Instruments like Qubit or spectrophotometers measure the total amount of DNA present in solution. This is also true of concentration measurements from an Agilent Bioanalyzer. The NGSBIO Library Quantification Kit for Illumina® will only quantify molecules that have both adapters. Moreover, qPCR is a much more accurate method of DNA quantification than fluorescence or spectrophotometric methods. It is normal for different quantification methods to yield different results.
If the concentration measured by qPCR is much lower than the concentration measured by other methods, it suggests that only a small proportion of molecules have been properly adaptor-ligated during adaptor ligation.
What should I do if my sample replicates show significant variability?
Inspect the melt curves to ensure there is a single product peak. If multiple peaks are present, this suggests the sample may be contaminated or degraded, or there was an error during size selection, adaptor ligation or library preparation. If the melt analysis shows only one peak, the variability may result from inaccurate pipetting. Make a new dilution of the sample and repeat the experiment, paying particular attention to accurate pipetting of the replicates. If the problem persists, it may be necessary to create a new library.
What should I do if my standards' replicates show significant variability?
± 0.2 cycle variation between replicates is normal. Inspect the melt curves to ensure there's a single product peak. (There may be a low molecular weight shoulder present, which is normal). If multiple peaks are present, this suggests the standards have been contaminated or degraded. If that standard can be excluded from analysis, do so. If not, new standards should be ordered and the experiment repeated.
If the melt curves show a single peak that overlaps between replicates, the variability may result from inaccurate pipetting. Repeat the experiment, giving particular attention to accurate pipetting of the standards.
Read more